NFDUMP
*** This project moved to Github.***
The documentation below is for legacy purpose only
This is a small description, what the nfdump tools do and how they work.
Nfdump is distributed under the BSD license - see BSD-license.txt - and
can be downloaded at https://github.com/phaag/nfdump
The nfdump tools collect and process netflow data on the command line.
They are part of the NfSen project which is explained more detailed
at
http://www.ripe.net/ripe/meetings/ripe-50/presentations/ripe50-plenary-tue-nfsen-nfdump.pdf
The Web interface is a separate project and available at http://sourceforge.net/projects/nfsen/
Dec 1, 2014: Current stable version: 1.6.13
The documentation is incomplete. An update will follow.
NFDUMP tools overview
All tools support netflow v5, v7 and v9.
nfcapd - netflow capture
daemon.
Reads the netflow data from the network and stores the data into files.
Automatically rotate files every n minutes. ( typically ever 5 min )
nfcapd reads netflow v5, v7 and v9 flows transparently. You need one nfcapd
process for each netflow stream.
nfdump - netflow dump.
Reads the netflow data from the files stored by nfcapd. It's syntax is
similar to tcpdump. If you like tcpdump you will like nfdump. Displays
netflow data and can create lots of top N statistics of flows
IP addresses, ports etc ordered by whatever order you like.
nfprofile - netflow profiler.
Reads the netflow data from the files stored by nfcapd. Filters the
netflow data according to the specified filter sets ( profiles ) and
stores the filtered data into files for later use.
nfreplay - netflow replay
Reads the netflow data from the files stored by nfcapd and sends it
over the network to another host.
nfclean.pl - cleanup old data
Sample script to cleanup old data. You may run this script every hour
or so.
ft2nfdump - Read and convert
flow-tools data.
Reads flow-tools data from files or from stdin in a chain of flow-tools
commands and converts the data into nfdump format to be processed by
nfdump.
Principle of Operation:
The goal of the design is to able to analyze netflow data from the past
as well as to track interesting traffic patterns continuously. The
amount of time back in the past is limited only by the disk space
available for all the netflow data. The tools are optimized for speed
for efficient filtering. The filter rules look familiar to the
syntax of tcpdump ( pcap like ).

All data is stored to disk, before analyzing. This separates the
process of storing and analyzing the data.
The data is organized in a time based fashion. Every n minutes -
typically 5 min - nfcapd rotates and renames the output file with the
time stamp nfcapd.YYYYMMddhhmm of the interval e.g. nfcapd.200407110845
contains data from July 11th 2004 08:45 onward.
Based on a 5min time interval, this results in 288 files per day.
Analyzing the data can be done for a single file, or by concatenating
several files for a single run. The output is either ASCII text or
binary data, when saved into a file, ready to be processed again with
the same tools.
You may have several netflow sources - let's say 'router1' 'router2'
and so on. The data is organized as follows:
/flow_base_dir/router1
/flow_base_dir/router2
which means router1 and router2 are subdirs of the flow_base_dir.
For each of the netflow sources you have to start an nfcpad process:
nfcapd -w -D -l /flow_base_dir/router1 -p 23456
nfcapd -w -D -l /flow_base_dir/router2 -p 23457
Security: none of the tools requires root privileges, unless you have a
port < 1024. However, there is no access control mechanism in
nfcapd. It is assumed, that host level security is in place to filter
the proper IP addresses.
See the manual pages or use the -h switch for details on using
each of
the programs. For questions, bug reports etc. send mail to Peter Haag
<haag@switch.ch>
Configuration:
Configure your router to export netflow. See the relevant documentation
for your model. A generic CISCO sample to enable Netflow on an
interface may look like:
interface fastethernet 0/0
ip route-cache flow
To tell the router where to send the netflow data, enter the following
global configuration command:
ip flow-export
ip flow-export version 5
ip flow-cache timeout active 5
This breaks up long-lived flows into 5-minute segments. You can choose
any number of minutes between 1 and 60, but should be equal or less
than the file rotation period - typically 5 minutes.
On the 6500/7600,
you must make sure to enable "NDE" in addition to normal Netflow
export. NDE (Netflow Data Export) is the hardware variant of
Netflow export on the Catalyst 6500/7600 OSR. Here's a
configuration example:
mls flow ip interface-full
mls flow ipv6 interface-full
mls nde sender version 5
Note that IPv6 NDE isn't implemented yet, but it
can still be useful to be able to look at the "live" flows with "show
mls netflow ipv6".
On a busy router, consider aggressively timing out small flows:
mls aging fast time 4 threshold 2
mls aging normal 32
mls aging long 900
You still want the "traditional" Netflow
configuration, including "ip flow ingress" or "ip route-cache flow" on
every interface, so that you see "software-switched" flows such as
those that go to the router itself. I assume this is the only traffic
that you are seeing right now.
See the relevant documentation for a full description of netflow
commands.
Note:
Netflow version v5 and v7 have 32 bit counter values. The number of
packets or bytes may overflow this value, within the flow-cache timeout
on very busy routers. To prevent overflow, you may consider to reduce
the flow-cache timeout to lower values. All nfdump tools use 64 bit
counters internally, which means, all aggregated values are
correctly
reported.
See the INSTALL file for installation details.
Netflow Processing:
Please have a look at the nfdump(1)
man page for a detailed explanation of all options available.
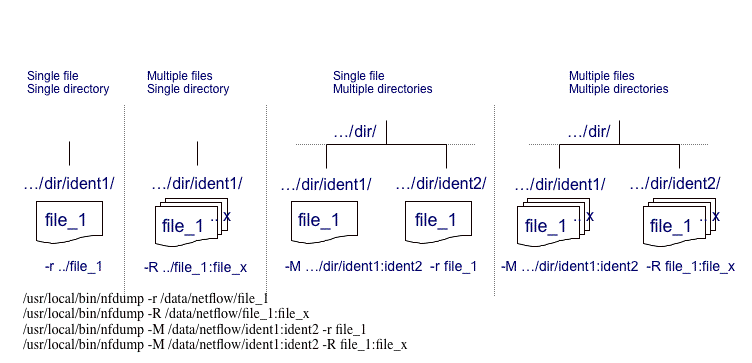
Flows are read either from a single file or from a sequence of files:

| -r <single file> |
Read a single file. |
| -R
</path/to/first-file:lastfile> |
Read data from a
sequence of files from /path/to/first-file to /path/to/last-file |
-M
/path/to/first-dir:next-dir:last-dir -r <single-file>
-M /path/to/first-dir:next-dir:last-dir -R <first-file:last-file> |
Read from a
sequence of files from several directories:
File sequence is:
/path/to/first-dir/single-file
/path/to/next-dir/single-file
/path/to/last-dir/single-file
or
/path/to/first-dir/first-file .... /path/to/first-dir/last-file
/path/to/next-dir/first-file .... /path/to/next-dir/last-file
/path/to/last-dir/first-file .... /path/to/last-dir/last-file |
| Specials: |
|
-R
</path/to/directory>
-M /path/to/first-dir:next-dir:last-dir -R . |
Read all files in a directory |
-R
</path/to/first-file>
-M /path/to/first-dir:next-dir:last-dir -R <first-file> |
Read all files in a directory starting with a given file |

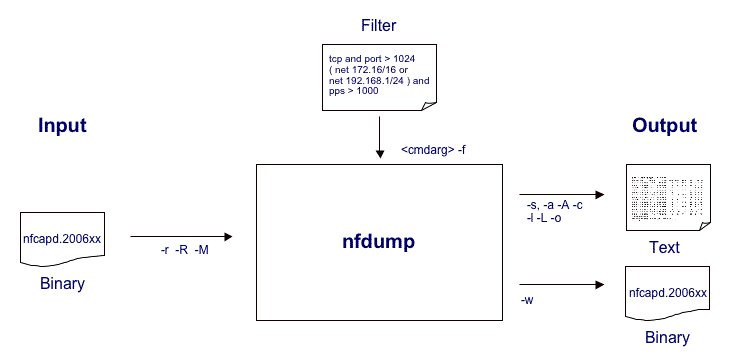
Processed flows can be either
printed in ASCII to stdout or written to a file. The binary file can be
read again by nfdump for further processing.
The diagrams below show at which point various options affect the
netflow processing for normal flow listings, date sorted listings and
statistic outputs.

Output formats:
nfdump has four fixed output formats: raw, line, long and extended. However the user may specify any desired output format using the custom output format fmt:...
The default format is line, unless otherwise specified.
Raw format:
The raw format displays each record in multiple lines, and prints any
available information in the record. The record printed is netflow
version independent, but may contain different additional fields depending on the source
Flow Record:
  Flags       =       0x00000000
  size        =               52
  mark        =                0
  srcaddr     =    36.249.80.226
  dstaddr     =    92.98.219.116
  First       =       1125377992 [2005-08-30 06:59:52]
  Last        =       1125377992 [2005-08-30 06:59:52]
  msec_first  =              338
  msec_last   =              338
  dir         =                0
  tcp_flags   =                0
  prot        =               17
  tos         =                0
  input       =                5
  output      =                3
  srcas       =             1299
  dstas       =                0
  srcport     =             3040
  dstport     =             1434
  dPkts       =                1
  dOctets     =              404
This format is rarely used, but
contains any information available for this record.
Line Format: -o line
This is the default format and shows one netflow record per line:
Date flow start         Duration Proto    Src IP Addr:Port         Dst IP Addr:Port   Packets    Bytes Flows
2005-08-30 06:59:52.338    0.001 UDP    36.249.80.226:3040  ->   92.98.219.116:1434         1      404     1
The date and Duration of the flow are given in millisecond resolution.
The number of flows is always 1 unless flows are aggregated. See below.
Long format: -o long
This format contains additional information such as TCP flags, Type of
Service ( Tos ) etc:
Date flow start         Duration Proto    Src IP Addr:Port         Dst IP Addr:Port   Flags Tos  Packets    Bytes Flows
2005-08-30 06:53:53.370   63.545 TCP   113.138.32.152:25    ->   222.33.70.124:3575  .AP.SF   0       62     3512     1
2005-08-30 06:53:53.370   63.545 TCP    222.33.70.124:3575  ->  113.138.32.152:25    .AP.SF   0       58     3300     1
Extended format: -o extended
This format contains additional information to format long: pps (
packet per second ) bps ( bits per second ) and bps ( bytes per packet
) are calculated and displayed for each record:
Date flow start         Duration Proto    Src IP Addr:Port         Dst IP Addr:Port   Flags Tos  Packets    Bytes      pps      bps    Bpp Flows
2005-08-30 06:53:53.370   63.545 TCP   113.138.32.152:25    ->   222.33.70.124:3575  .AP.SF   0       62     3512        0      442     56     1
2005-08-30 06:53:53.370   63.545 TCP    222.33.70.124:3575  ->  113.138.32.152:25    .AP.SF   0       58     3300        0      415     56     1
Time window: Aug 30 2005 06:53:53 - Aug 30 2005 06:54:56
This format gives most information on one line.
Custom output format: -o fmt:..
This is the most flexibel format, as you can specify yourself how the
output looks like. The output format is defined using element tags as
well as plain ascii text.
Predefined element tags:
| Tag |
Description |
Tag |
Description |
| %ts |
Start Time - first seen |
%in |
Input Interface num |
| %te |
End Time - last seen |
%out |
Output Interface num |
| %td |
Duration |
%pkt |
Packets |
| %pr |
Protocol |
%byt |
Bytes |
| %sa |
Source Address |
%fl |
Flows |
| %da |
Destination Address |
%pkt |
Packets |
| %sap |
Source Address:Port |
%flg |
TCP Flags |
| %dap |
Destination Address:Port |
%tos |
Tos |
| %sp |
Source Port |
%bps |
bps - bits per second |
| %dp |
Destination Port |
%pps |
pps - packets per second |
| %sas |
Source AS |
%bpp |
bps - Bytes per package |
| %das |
Destination AS |
|
|
Example: The format -o long can be described as follows:
-o “fmt:%ts %td %pr %sap -> %dap %pkt %byt %fl"
Often used output formats can be compiled into nfdump for easy accesss.
See nfdump.c source file for defining more output formats.
Printing IPv6 records:
IPv6 addresses need much more space to print than IPv4 addresses. In
order to keep the output clearly arranged, IPv6 addresses are shrinked
in normal output.
Date flow start          Duration Proto      Src IP Addr:Port          Dst IP Addr:Port   Packets    Bytes Flows
2006-03-09 11:55:03.900     0.000 ICMP6 2005:62..2c:9c10.0     -> 2005:62..c000::d.0            1      104     1
The middle part of each IPv6 address will be cutted, but should allow
to identify addresses, though. If the full length of IPv6 addresses is
required, add the digit '6' to the output format ( e.g. -o line6, -o long6, -o extended6 ) or add the option -6 ( e.g. -o extended -6 ).
Date flow start          Duration Proto                      Src IP Addr:Port                Dst IP Addr:Port   Packets    Bytes Flows
2006-03-09 11:55:03.900     0.000 ICMP6  2005:620:0:8:203:baff:fe2c:9c10.0     ->     2005:620:0:c000::d.0            1      104     1
Aggregating Flows: -a [ -A
<scheme>]
Flows can be aggregated by specifying -a. By default, flows with
identical protocol and identical source and destination IP address
as well as identical source and destination ports are aggregated.
However, this behavior can be changed by specifying a different
aggregation scheme with -A. -A accepts any combination srcip, dstip, srcport, dstport.
Examples:
Default aggregation: 10 flows aggregated.
Date flow start         Duration Proto    Src IP Addr:Port         Dst IP Addr:Port   Packets    Bytes Flows
2005-08-30 06:59:54.324  250.498 TCP    63.183.112.97:9050  ->   146.69.72.180:51899       12     2198    10
Aggregate source IP address and destination port: -A srcip,dstport
Date flow start         Duration Proto    Src IP Addr:Port         Dst IP Addr:Port   Flags Tos  Packets    Bytes      pps      bps    Bpp Flows
2005-08-30 06:59:25.137  213.697 TCP     32.249.32.48:0     ->         0.0.0.0:135   ......   0       23     1104        0       41     48    13
2005-08-30 06:59:24.563  330.110 TCP   49.112.228.156:0     ->         0.0.0.0:1433  ......   0    47943    2.2 M      145    55769     48 27864
2005-08-30 06:59:54.322  201.857 TCP  148.190.164.126:0     ->         0.0.0.0:36129 ......   0       10      460        0       18     46     6
2005-08-30 06:59:54.257   48.768 TCP      92.90.57.46:0     ->         0.0.0.0:59501 ......   0        5      230        0       37     46     2
All other elements, not aggregated are set to '0'.
Subnet aggregation.
It is also possible to aggregate flows on a subnet level. In order to
create appropriate masks for aggregation, the protocol version is
required with the address field:
Example: -a -A srcip4/24, dstport aggregates flows on a /24 IPv4 base and destination port.
Filter Syntax:
nfdump has a powerful and fast filter engine. All flow are filtered
before they are further processed. If no filter is given, any flow will
be processed. The filter is either given on the command line as
last argument enclosed in ',
or in a file. Any line in the file starting with a # is treated as a comment. The
filter syntax is similar to the tcpdump syntax.
Any filter consists of one or more
expressions expr. Any number
of expr can be linked together:
expr
and expr, expr or expr,
not expr, ( expr ).
expr
can be one of the following filter primitives:
protocol version
inet or ipv4 for IPv4 and inet6 or ipv6 for IPv6 flows only
protocol
TCP, UDP, ICMP, GRE, ESP, AH, RSVP
or PROTO <num> where num
is the protocol number.
IP address
[SourceDestination] IP a.b.c.d or
[SourceDestination] HOST a.b.c.d
with a.b.c.d as any valid IP address. SourceDestination may be
omitted.
SourceDestination
defines the IP address to be selected and can be SRC, DST or any combination of SRC and|or DST. Omitting
SourceDestination is equivalent
to SRC or DST.
network
[SourceDestination] NET a.b.c.d
m.n.r.s
[SourceDestination] NET a.b.c.d / num
with a.b.c.d as network number, m.n.r.s as netmask or num as maskbits
respectively. The network
may be
given as a.b, a.b.c, where a B or C-class
equivalent netmask is assumed.
Port
[SourceDestination] PORT
[comp] num with num as a valid
port number. If comp is omitted, '=' is assumed.
Interface
[inout] IF num with num
as an interface number.
inout
defines
the interface to be selected and can be IN or OUT.
Flags
flags tcpflags with tcpflags as a
combination of:
A ACK.
S SYN.
F FIN.
R Reset.
P Push.
U Urgent.
X All flags on.
The ordering of
the flags is not relevant. Flags not mentioned are treated as
don't care. In order to get those flows with only the SYN
flag set, use the syntax 'flags S and not flags AFRPU'.
TOS Type of service: tos value with value 0..255.
Packets
packets [comp] num [scale] to specify the packet
count in the netflow record.
Bytes
bytes [comp] num [scale] to specify the byte
count in the netflow record.
Packets per second:
Calculated value.
pps [comp] num [scale] to specify the pps of
the flow.
Duration: Calculated value
duration [comp] num to specify the duration in
milliseconds of the flow.
Bits per second: Calculated
value.
bps [comp] num [scale] to specify the bps of
the flow.
Bytes per packet:
Calculated value.
bpp [comp] num [scale] to specify the bpp of
the flow.
AS
[SourceDestination] AS num
with num as a valid AS number.
scale Scaling factor. Maybe
k m g. Factor is 1024
comp The following
comparators are supported:
=, ==, >, <, EQ, LT, GT
. If comp is omitted, '='
is assumed.
Examples:
nfdump -r
/and/dir/nfcapd.200407110845 -c 100 'tcp
and ( src ip 172.16.17.18 or dst ip 172.16.17.19 )'
nfdump -r
/and/dir/nfcapd.200407110845 -A srcip,dstport 'in if 5 and net 10.0.0.0/24 and not host
10.0.0.1 and bps > 10k and duration < 100 and dst port 1433'
Top N Statistics: [ -n <num> ]
-s type[/orderby]
nfdump provides a number of statistics. These can be requested be
supplying one or more -s arguments: -s
type[/orderby] where as type can be:
| record |
Statistic about aggregated netflow records. |
| srcip |
Statistic about source IP addresses |
| dstip |
Statistic about destination IP addresses |
| ip |
Statistic about any (source or destination) IP addresses |
| srcport |
Statistic about source ports |
| dstport |
Statistic about destination ports |
| port |
Statistic about any (source or destination) ports |
| srcas |
Statistic about source AS numbers |
| dstas |
Statistic about destination AS numbers |
| as |
Statistic about any (source or destination) AS numbers |
| inif |
Statistic about input interface numbers |
| outif |
Statistic about output interface numbers |
| if |
Statistic about any ( input or output ) interface numbers |
| proto |
Statistic about protocol numbers |
orderby is optional and
specifies the order by which the statistics is ordered and can be flows, packets, bytes, pps, bps or bpp. You may specify more than one
orderby which results in the same statistic but ordered differently. If
no orderby is given, statistics are ordered by flows. You can
specify as many -s arguments on the command line for the same run.
The record statistics can be formated according to the available output
formats given by -o ( see above ).
Top N defaults to 10 unless specified otherwise by supplying -n <num>. -n 0 means unlimited
number, unless for -s record,
which n is limited to 1000.
Example: nfdump -r nfcapd.200508300700 -o extended -s srcip -s ip/flows
-s dstport/pps/packets/bytes -s record/bytes
Aggregated flows 850332
Top 10 flows ordered by bytes:
Date flow start         Duration Proto    Src IP Addr:Port         Dst IP Addr:Port   Flags Tos  Packets    Bytes      pps      bps    Bpp Flows
2005-08-30 06:50:11.218  700.352 TCP     126.52.54.27:47303 ->    42.90.25.218:435   ......   0    1.4 M    2.0 G     2023    5.6 M   1498     1
2005-08-30 06:47:06.504  904.128 TCP   198.100.18.123:54945 ->    126.52.57.13:119   ......   0   567732  795.1 M      627    2.5 M   1468     1
2005-08-30 06:47:06.310  904.384 TCP     126.52.57.13:45633 ->  91.127.227.206:119   ......   0   321148  456.5 M      355    4.0 M   1490     1
2005-08-30 06:47:14.315  904.448 TCP     126.52.57.13:45598 ->  91.127.227.206:119   ......   0   320710  455.9 M      354    4.0 M   1490     1
2005-08-30 06:47:14.316  904.448 TCP     126.52.57.13:45629 ->  91.127.227.206:119   ......   0   317764  451.5 M      351    4.0 M   1489     1
2005-08-30 06:47:14.315  904.448 TCP     126.52.57.13:45634 ->  91.127.227.206:119   ......   0   317611  451.2 M      351    4.0 M   1489     1
2005-08-30 06:47:06.313  904.384 TCP     126.52.57.13:45675 ->  91.127.227.206:119   ......   0   317319  451.0 M      350    4.0 M   1490     1
2005-08-30 06:47:06.313  904.384 TCP     126.52.57.13:45619 ->  91.127.227.206:119   ......   0   314199  446.5 M      347    3.9 M   1490     1
2005-08-30 06:47:06.321  790.976 TCP     126.52.54.35:59898 ->   132.94.115.59:2466  ......   0   254717  362.4 M      322    3.7 M   1491     1
2005-08-30 06:47:14.316  904.384 TCP     126.52.54.35:59773 ->  55.107.224.187:11709 ......   0   272710  348.5 M      301    3.1 M   1340     1

Top 10 Src IP Addr ordered by flows:
Date first seen         Duration     Src IP Addr    Flows  Packets    Bytes      pps      bps   bpp
2005-08-30 06:45:50.990 1147.332  125.67.123.234   109183   202523   13.1 M      176    96116    68
2005-08-30 06:45:02.928 1192.834  94.180.151.203    62794   219715   25.9 M      184   182294   123
2005-08-30 06:59:24.563  330.110    9.209.28.173    27864    47943    2.2 M      145    55769    48
2005-08-30 06:45:07.728 1190.594  125.248.33.146    17271    41942    5.7 M       35    40438   143
2005-08-30 06:59:16.431  341.892   138.5.122.251    12253    75925   39.2 M      222   962768   541
2005-08-30 06:59:48.111  310.211  130.195.23.210    11742    46928    3.2 M      151    86940    71
2005-08-30 06:59:54.066  304.257   255.93.216.43    11383    56943    4.5 M      187   123968    82
2005-08-30 06:59:53.362  304.894   219.182.16.57    11209    44784    2.0 M      146    54640    46
2005-08-30 06:47:06.503 1068.361      3.15.99.52     9000    16962    3.1 M       15    24415   192
2005-08-30 06:59:52.784  172.102  11.121.123.165     7176     7176   330096       41    15344    46

Top 10     IP Addr ordered by flows:
Date first seen         Duration         IP Addr    Flows  Packets    Bytes      pps      bps   bpp
2005-08-30 06:45:50.990 1147.332  125.67.123.234   234366   458197   30.2 M      399   221164    69
2005-08-30 06:45:02.928 1192.835  94.180.151.203   115841   428885   42.6 M      359   299577   104
2005-08-30 06:45:07.728 1190.594  125.248.33.146    28218    73178    7.8 M       61    55234   112
2005-08-30 06:59:24.563  330.110    9.209.28.173    27916    48086    2.2 M      145    55931    47
2005-08-30 06:59:48.111  310.212  130.195.23.210    23467   105779    7.9 M      340   212311    77
2005-08-30 06:59:53.362  304.960   219.182.16.57    22938    89563    4.0 M      293   109251    46
2005-08-30 06:59:54.066  304.257   255.93.216.43    22769   102496    7.6 M      336   210205    77
2005-08-30 06:59:16.431  341.892   138.5.122.251    21840   132119   45.3 M      386    1.1 M   359
2005-08-30 06:46:33.104 1102.656  129.251.42.241    20305    74505    5.8 M       67    43757    80
2005-08-30 06:47:07.272 1068.360 131.250.225.247    14452    36714    3.1 M       34    24078    87

Top 10    Dst Port ordered by packets:
Date first seen         Duration        Dst Port    Flows  Packets    Bytes      pps      bps   bpp
2005-08-30 06:45:55.150 1129.287             119       99    3.3 M    4.7 G     3079   34.1 M  1450
2005-08-30 06:45:47.858 1150.465              80    56282    1.4 M  135.1 M     1307   984959    94
2005-08-30 06:47:06.375 1032.270             435        5    1.4 M    2.0 G     1410   16.0 M  1488
2005-08-30 06:45:41.715 1157.052               0    40088    1.4 M  261.0 M     1225    1.8 M   192
2005-08-30 06:45:26.415 1171.905            6881     8898   592649  545.1 M      505    3.7 M   964
2005-08-30 06:47:06.310 1032.335             433       13   588268  814.3 M      569    6.3 M  1451
2005-08-30 06:45:02.928 1195.523              53   140178   481356   37.1 M      402   260537    80
2005-08-30 06:44:59.090 1199.038            4662     9238   344122  267.1 M      286    1.8 M   813
2005-08-30 06:45:50.990 1144.773             123   176044   302564   23.0 M      264   168866    79
2005-08-30 06:47:14.316  939.333           11709        4   272713  348.5 M      290    3.0 M  1339

Top 10    Dst Port ordered by bytes:
Date first seen         Duration        Dst Port    Flows  Packets    Bytes      pps      bps   bpp
2005-08-30 06:45:55.150 1129.287             119       99    3.3 M    4.7 G     3079   34.1 M  1450
2005-08-30 06:47:06.375 1032.270             435        5    1.4 M    2.0 G     1410   16.0 M  1488
2005-08-30 06:47:06.310 1032.335             433       13   588268  814.3 M      569    6.3 M  1451
2005-08-30 06:45:26.415 1171.905            6881     8898   592649  545.1 M      505    3.7 M   964
2005-08-30 06:47:06.321 1053.251            2466       30   255460  363.4 M      242    2.8 M  1491
2005-08-30 06:47:14.316  939.333           11709        4   272713  348.5 M      290    3.0 M  1339
2005-08-30 06:48:42.325  904.448           52911        5   191559  274.0 M      211    2.4 M  1499
2005-08-30 06:44:59.090 1199.038            4662     9238   344122  267.1 M      286    1.8 M   813
2005-08-30 06:45:41.715 1157.052               0    40088    1.4 M  261.0 M     1225    1.8 M   192
2005-08-30 06:47:06.313 1065.928            1101       83   173933  248.4 M      163    1.9 M  1497

Top 10    Dst Port ordered by pps:
Date first seen         Duration        Dst Port    Flows  Packets    Bytes      pps      bps   bpp
2005-08-30 06:45:55.150 1129.287             119       99    3.3 M    4.7 G     3079   34.1 M  1450
2005-08-30 07:02:55.248    0.002           39601        3        5      748     2499    2.9 M   149
2005-08-30 07:00:28.817    0.512           54286        1     1279    66882     2498  1045031    52
2005-08-30 06:47:06.375 1032.270             435        5    1.4 M    2.0 G     1410   16.0 M  1488
2005-08-30 06:45:47.858 1150.465              80    56282    1.4 M  135.1 M     1307   984959    94
2005-08-30 06:45:41.715 1157.052               0    40088    1.4 M  261.0 M     1225    1.8 M   192
2005-08-30 07:00:28.305    0.002           56997        2        2       92      999   367999    46
2005-08-30 07:03:55.859    0.064           47264        1       40    49456      624    5.9 M  1236
2005-08-30 06:47:06.310 1032.335             433       13   588268  814.3 M      569    6.3 M  1451
2005-08-30 07:02:44.692    0.064            8612        1       33    41848      515    5.0 M  1268

Time window: Aug 30 2005 06:44:54 - Aug 30 2005 07:04:58
Flows analysed: 1115890 matched: 1115890, Bytes read: 54486168
Sys: 2.286s flows/second: 488001.9   Wall: 2.386s flows/second: 467490.9
Anonymizing Flows: -K <key>
IP addresses in flows can be anonymized by supplying -K <key>.
nfdump uses the Crypto-PAn module to anonymize IP addresses. See http://www.cc.gatech.edu/computing/Telecomm/cryptopan/
for further details of Crypto-PAn. key
is either a 32 character string or a 64 digit hex string starting with
0x.
IP addresses are anonymized before they are printed or saved to file.
This means the filter applies to the original IP address.
Converting flow-tools netflow data:
The flow-tools converter reads flow-tools data either from stdin, or
from a given file ( -r ). It converts the data into nfdump format and
writes nfdump records to stdout.
To concert a file: ft2nfdump -r <flow-tools-file> | nfdump -w
<nfdump-file>. Of course you can supply any other nfdump command
line switches to directly process flow-tools data with nfdump.


